
IT – INSIGHT ®
Comprehensive monitoring solution infrastructure, equipment and services.
Your investment in infrastructure is a vital asset of the company and business continuity, keeping these applications and services available online every day more effort represents the complexity and growth of the same. dynamic virtual environments, legacy applications, online applications under different development platforms, storage solutions and a collection of network devices and infrastructure such as routers, switches, access points, and firewalls. That is why POSTECH ® has developed one of the tools friendlier monitoring and greater scope in the market, monitor IT - INSIGHT Postech allows review of components in the network effectively, and concentrating all information obtained in graphics boards organized reporting that provide a quick view for decision making, achieving organize, mapping and monitoring complex environments alert infrastructure and allowing achieve compliance levels based on standards to achieve a service-oriented monitoring.
IT-Insight is a system widely used network monitoring, which monitors the equipment (hardware) and services (software) you specify, alerting when their behavior is not desired. Among its main features include monitoring network services (SMTP, POP3, HTTP, SNMP ...), monitoring systems hardware resources (processor load, disk usage, memory, port status .. .), regardless of operating systems, remote monitoring possibility through SSL or SSH encrypted tunnels, and the ability to schedule specific plugins for new systems. It is a software that provides great versatility to consult virtually any parameter of interest of a system, and generates alerts that can be received by the relevant responsible by (inter alia) e-mail and SMS messages, when these parameters exceed the margins set by the network administrator.
Challenge for ICT managers
The challenge for managers of information technology and business communication today is to achieve and maintain services and applications available as long as possible thus managing to reach agreements highest service users or organizations they serve. To support these increasingly complex infrastructure is necessary to have business views that enable ICT managers understand the vision of the business areas of the organization, allowing monitoring to deliver a board that not only represent the state keep the components of the infrastructure, but also allow the state to keep delivering business processes, and thus is more effective because it allows monitoring processes to integrate these infrastructure components on which it depends.
Benefits
 Increases productivity of their IT resources. Implementation times and inclusion very short. Consolidation of systems and resources for service views (SOA). High of key performance indicators (KPI) and service contracts SLA's for measurement in reference to registration Monitor. Sending alerts in real time via SMS, email, or dashboard.
Visibility
It provides a central view of the entire network of operations and business processes. Being able to get metrics from the first day that the tool is connected to the network and initial parameters are set. Integra control panels with access to information, with reports and graphs. These views provide users quick access to information that is most useful. The user can customize the metrics described or included in the default template.
characteristics
Thresholds and customizable alerts, capable of omission of alarm from the interface graphics devices. The server is available as appliance monitoring and virtual machine format. Real-time management Incident. Custom development of additional connectors for unsupported or proprietary applications. Monitoring of network services (SMTP, POP3, HTTP, HTTP, ICMP, SNMP). Monitoring equipment hardware resources (processor load, disk usage, system logs) on multiple operating systems. Check stopped services. Ability to define the hierarchy of the network, allowing fallen distinguish between host and host inaccessible. Ability to define event handlers running at an event occurrence of a service or host for proactive resolutions of problems. Automatic log file rotation. Support for implementing redundant hosts monitors. Viewing the network status in real time via web interface, with the ability to generate reports and graphs of behavior of the monitored systems, and display the list of notifications, problem history, log files.Comprehensive monitoring
It provides monitoring of all infrastructure components including mission-critical applications, services, operating systems, network protocols. With support for a large number of plugins will allow you to track virtually all internal applications, services and systems. It lets get metrics for each supported device component and includes default performance monitoring, utilization and availability of discovered or added components.
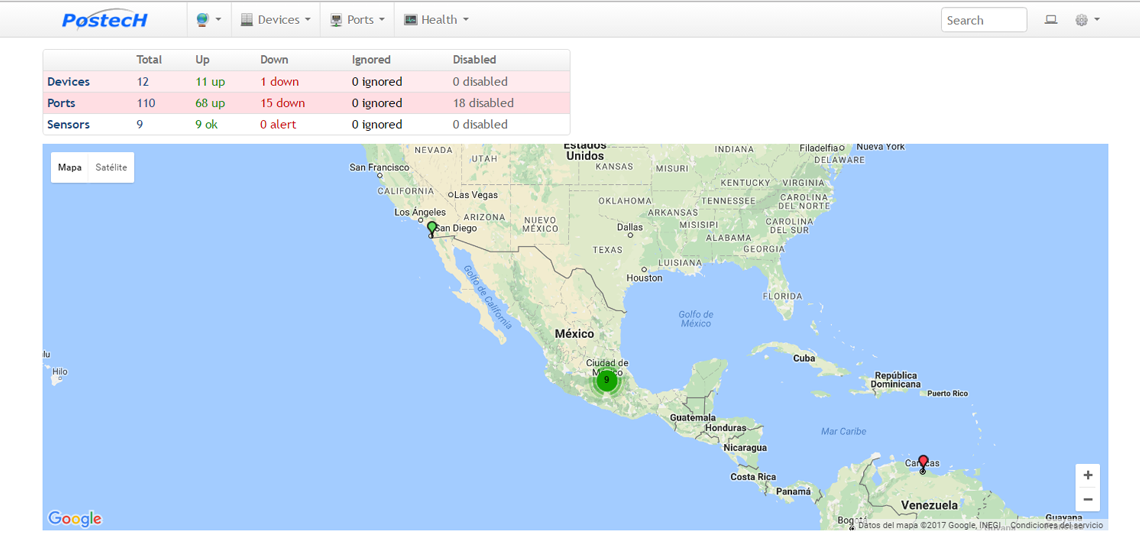
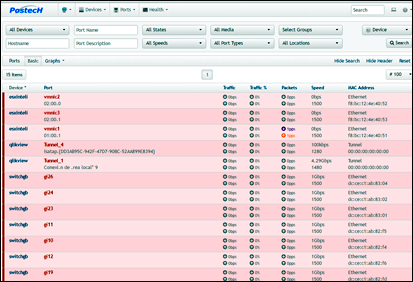
Example
Easy to use
Console access web interface that allows users to know the status of the monitors.
Configuration Wizards guide users through the process of monitoring new devices, services and applications - all without having to understand complex concepts monitoring. The tool also allows to generate groups of components to be identified and add their different alertamientos and thresholds, as well as the ability to navigate within the device to know its history or details of their level or form of arousal and behavior in periods of set time, in addition to a contextual help menu.
Differentiators
Automated device discovery engine available via SNMP, WMI or methods of high MIBS or manually using external configuration files. Predefined for review and administration of the different profiles of monitoring templates as application or device. Support agents to query snmp environments without support, or for applications or handlers specific database. Historical analysis of information with high capacity metric for management and support capabilities in decision making technological renovation or growth. Support for generating useful to measure user experience, stress testing, load performance or synthetic transactions. Integration with scripts end to end for measuring application response times. Remote monitoring through SSL or SSH encrypted tunnels. Customizable arousal levels including device information, cautions and critical levels. Native integration with mapping service log (syslog server).Reporting and History
A powerful graphical user interface provides customization design and preferences depending on each user, giving its users and team members the flexibility required. Centralized storage of records, capable of generating circular stores that allow you to set the retention time and shelter.
Among the reports included are alerted TOP 20 most devices in detail, latest devices troubled last 24 hours between some reports and reports by date range, type of component, associated group, etc.
Access control
The application also provides advanced user management that simplifies management by allowing multiple user levels with customizable control panels. And also has audit log, where all activities performed by users.
Proactive - Planning
Automated, integrating trends and labor camps planning allows organizations to plan infrastructure improvements before incidents within the same.
Extensible Architecture
INSIGHT IT- API system provides easy integration with internal and third-party applications, and the ability to create or generate additional commands or customized commands to adjust the monitoring review.
We invite you to contact our sales department mail ventas@postech.com.mx or using our form contact online and so allow us to support you to develop a solution tailored to their needs in information technology and communications.